Outlines
- Statistical Thinking
- Analytics and Statistics
- Statistics for Decision Making and
- Competitive Advantage
Statistical Thinking
Impression:统计学的概念
Statistics is not only about mathematics. Instead, statistics is about a philosophy, a perspective, and a set of tools that help us understand the world.
uncertainty + variability –> outcomes –> observations –> data
Statistics is the science of collecting, displaying, analyzing, and interpreting data.
data –> information –> knowledge –> insight –> action
Do decision-making based on the results
Typical Tasks in Statistics
- 1. Collecting data
- Observations, surveys, experiments, sampling
- Probability, probability distribution, random variables
- Sampling distributions
- 2. Displaying data
- Descriptive statistics: graphical, numerical
- Exploratory Data Analysis (EDA), visualization
- 3. Analyzing data
- Inferentialstatistics: estimation, hypothesis testing
- Regression-type models
- Multivariate analysis
- Advanced modelling: time series, classification, survival analysis …
- 4. Interpreting data and decision making
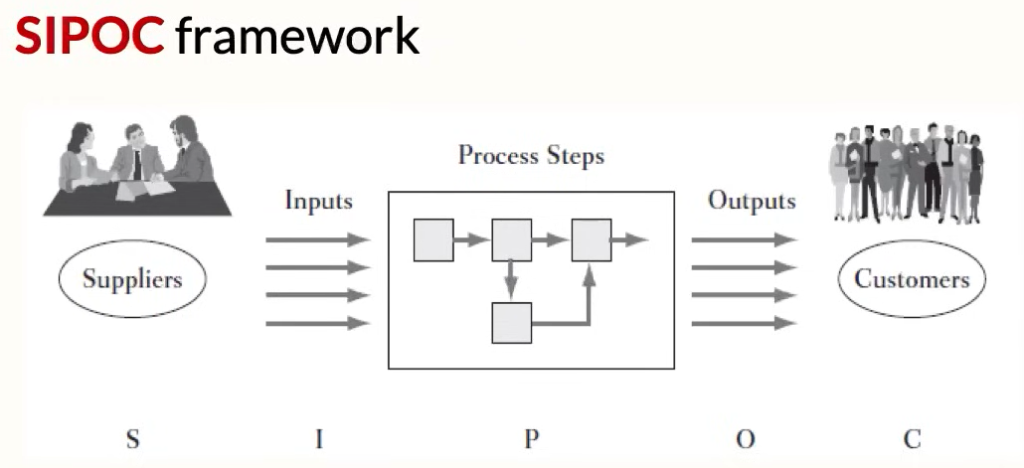
Process View
Everything that is of our interest about uncertainty and variability must be observed and collected in some processes.
Merely collecting huge amount of data is useless!
Your data must be studied structurally to facilitate decision making and action taking
Thus,statistical modelling is essential!
- Data is man-made, with purpose.
- Data is obtained from processes, with context.
- Data is used to gain insight, support decision
- making, and solve problems.
- Thus, data must be designed.
- Why
- What
- How
- When
- Where
- Who: Processors / Suppliers / Customers
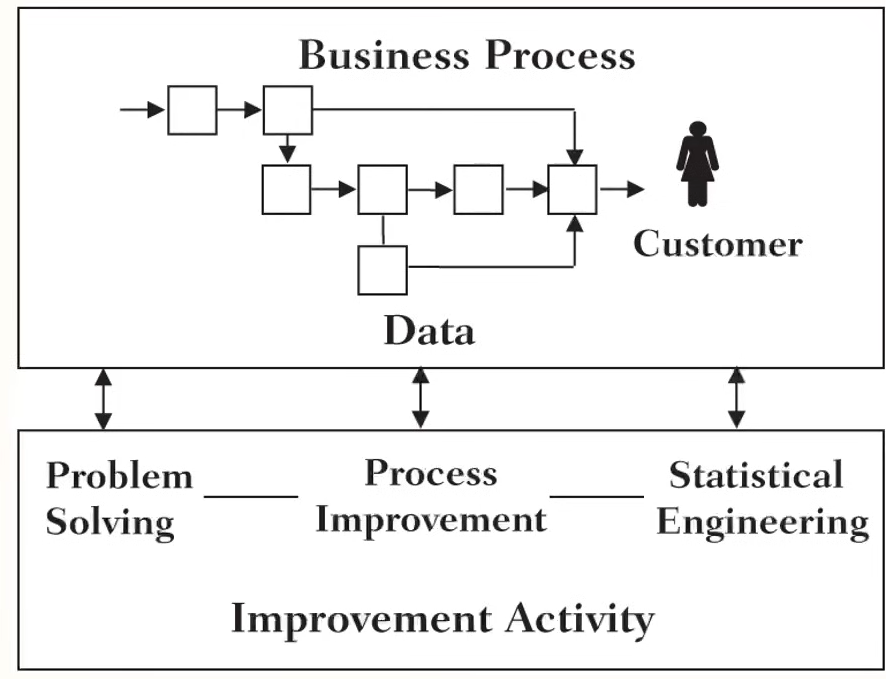
Problem Solving
- Problem Solving addresses specific problems that are not part of the normal behavior of the process.
- These issues are often discovered in the process improvement analysis and can be resolved without fundamentally changing the process.
- 1. Document the scope of the problem.
- 2. ldentify the root causes.
- 3. Select,implement, and standardize corrections
Process Improvement
- 1. Flowcharting the process to understand it better
- 2. Collecting data to assess the current performance
- 3. ldentifying areas where the process could be fundamentally improved
- 4. Changing the process to implement improvement ideas
- 5. Checking the impact of improvement efforts
- 6. Making the improvements part of the standard way of doing business
Statistical Engineering
- Some problems faced in business are large, complex, and unstructured. There may not be a clear understanding of what the problem actually is, or how to approach it.
- In such cases, we need Statistical Engineering.
- This approach takes longer, because it requires significant effort to define and structure the problem and then engineer a strategy to solve it.
- A company may go through this cycle several times in the course of improving a process.
The Role of Data
- Data are the connectors or links between the doing and improving activities.
- Data fuel all three of the improvement activities and increase their effectiveness.
- Data help us document process performance, identify problems, and evaluate the impact of proposed solutions.
- Note that data is not synonymous with information.
Statistical Thinking
Statistical Thinking is a philosophy of learning and action based on these fundamental principles:
- 1. All work occurs in a system of interconnected processes.
- 2. Variation exists in all processes.
- 3. Understanding and reducing variation are keys to success.
Statistical Point of View
From a statistical point of view improvement activity can be viewed as working on either of
two process characteristics:
- reducing variation through tighter control of the process
- improving the overall level (average value) by changing the process target, which may also result in reduced variation.
Principle of Statistical Thinking
- The third principle of statistical thinking is that understanding and reducing variation are keys to success.
- The average performance of any process is a function of various factors involved in the operation of the process.
- Three types of variations we may need to reduce are systematic variation, outliers, and random or common cause.
Analytics and Statistics
- Analytics
- Analytics is the scientific process of transforming data into insight for making better decisions.
- Data
- Transforming data
- Insight
- Decisions > Making better decisions
- Scientific process
- Information-based strategy / Data-driven decision-making
- Make better business decisions with analytics – data collection and analysis
- Analytics is the scientific process of transforming data into insight for making better decisions.
- Analytics and Business
- To provide management with a better appreciation of the value of data analytics.
- To communicate concepts of statistics and data mining in plain language.
- To illustrate how data can add value to the everyday life of business executives.
- Includes:
- Statistics
- Management Science /Operational Research
- (MS/OR)
- Optimization, Simulation, Decision Analysis …
- Levels of Analytics
- Descriptive – What is happening?
- Diagnostic Analytics – Why did it happen?
- Predictive Analytics – What will happen?
- Prescriptive Analytics – Whta is the best straegy?
Views: 5